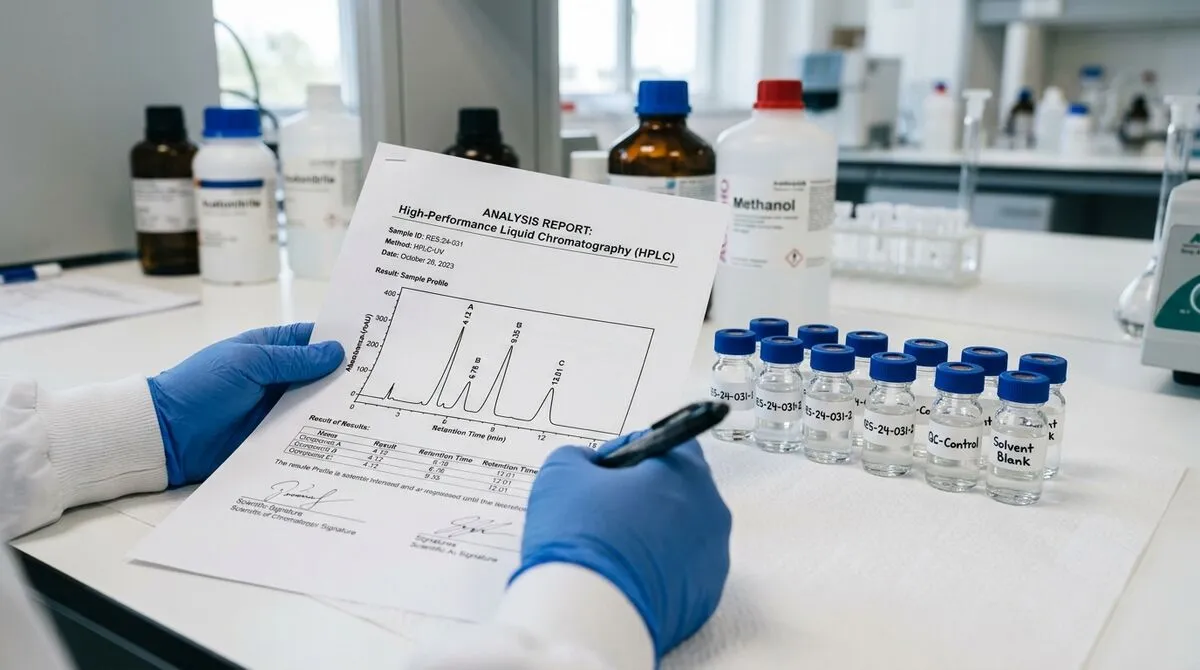
Most researchers accept peptide purity claims without being able to evaluate them. That's not a criticism — reading analytical chemistry documentation takes specific knowledge that isn't always part of a life sciences training. But with major suppliers closing and a wave of new vendors entering the market, the ability to read a Certificate of Analysis critically has become a practical research skill, not just a nice-to-have.
This guide covers the full analytical chain: what HPLC actually measures, how to interpret a chromatogram without a chemistry degree, what mass spectrometry adds that HPLC can't provide, and the specific red flags that separate genuine analytical documentation from a PDF that's been designed to look like one.
Contents
- What a Certificate of Analysis Actually Is
- HPLC Fundamentals: What It Measures and How
- Reading an HPLC Chromatogram
- Purity Thresholds: The 95% and 98% Standards Explained
- Mass Spectrometry: Identity Confirmation Beyond Purity
- Interpreting Mass Spectrometry Data
- Common Impurities in Synthetic Peptides
- Red Flags: When a CoA Isn't What It Claims to Be
- Verifying Janoshik CoAs: The Step-by-Step Process
- The Complete CoA Evaluation Checklist
- FAQ
What a Certificate of Analysis Actually Is
Quick answer: A genuine Certificate of Analysis is a formal document from an analytical laboratory reporting the results of specific tests on a specific production lot of a compound. It's not a quality guarantee — it's a documented measurement. The critical word is "batch-specific."
The term "Certificate of Analysis" is used loosely in the research compound market, which creates confusion. In pharmaceutical and industrial chemistry, a CoA is a regulated document with strict format and content requirements. In the research peptide space, it's often used to describe anything from rigorous third-party analytical reports to marketing PDFs that contain a single number.
Understanding the distinction requires knowing what a real CoA contains and why each element matters. The rest of this guide builds that understanding systematically.
Batch-Specific vs. Generic CoAs
The single most important distinction is whether a CoA refers to a specific production lot or represents a general quality statement about a compound. A batch-specific CoA identifies the exact production run by lot number, specifies the analysis date, and reflects the actual measurements taken on that batch — not a historical average or a target specification.
A generic CoA says "Purity: ≥98%" without specifying which batch or when it was measured. This is analytically meaningless. Any compound that was once tested at 98% purity could have degraded, been incorrectly stored, or been replaced by a different synthesis batch — none of which a generic CoA would reflect.
In-House vs. Third-Party CoAs
In-house testing — where the supplier runs their own analytical instruments and issues their own CoA — is structurally compromised by conflict of interest. The entity with financial incentive to report high purity is the same entity reporting purity. This doesn't mean in-house CoAs are always fabricated, but it means they're not independently verifiable.
Third-party testing by an independent laboratory removes the conflict of interest. If that laboratory also maintains a publicly searchable database of results — as Janoshik does — the results become cross-verifiable by any researcher, regardless of what the supplier claims.
HPLC Fundamentals: What It Measures and How
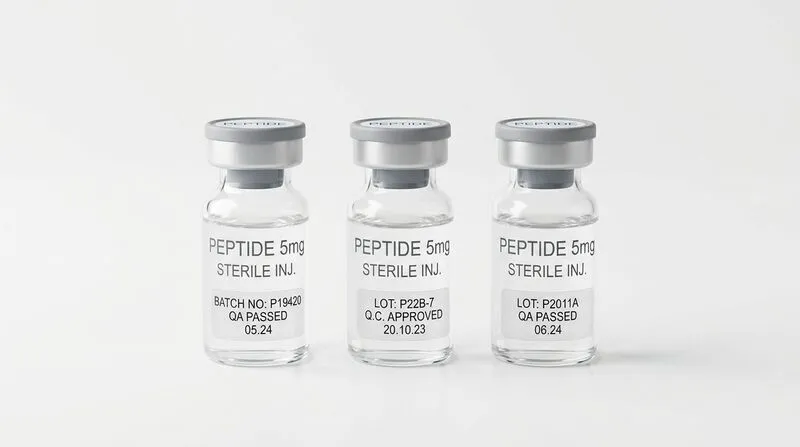
Quick answer: HPLC separates compounds by their differential affinity for a stationary phase, then detects them with UV absorbance or other detectors. The relative peak areas in the resulting chromatogram give a quantitative purity measurement.
High-Performance Liquid Chromatography works by forcing a sample dissolved in liquid (the mobile phase) through a column packed with a solid material (the stationary phase). Different compounds travel through the column at different speeds based on their chemical affinity for the stationary phase — this differential travel time is called "retention time" and is what separates compounds from each other.
The Reverse-Phase HPLC Standard
Peptide analysis almost universally uses reverse-phase HPLC (RP-HPLC). In this configuration, the stationary phase is hydrophobic (typically C18-bonded silica) and the mobile phase is a gradient of water and acetonitrile with a modifier like trifluoroacetic acid. Hydrophilic compounds elute first (shorter retention time); hydrophobic compounds elute later.
Peptide length and amino acid composition determine hydrophobicity and therefore retention time. A specific peptide will have a characteristic retention time under defined HPLC conditions — which is one reason the instrument parameters listed in a CoA (column type, gradient programme, flow rate) matter. Without these parameters, the retention time data is uninterpretable.
Detection Methods
The most common detection method for peptides is UV absorbance at 220nm. At this wavelength, the peptide bond absorbs UV light, so essentially all peptide compounds produce a signal regardless of their specific amino acid sequence. This makes 220nm detection broadly applicable and appropriate for purity measurement.
Some CoAs also report detection at 254nm or 280nm, which target specific chromophores (aromatic residues like Trp, Tyr, Phe). A 280nm reading provides additional structural information but isn't required for a complete purity analysis.
Purity by Peak Area
Purity is calculated from peak areas. The total area under all peaks represents 100% of the detectable material. The area of the main peak, expressed as a percentage of total area, is the purity figure. A 98.7% pure compound has a main peak that accounts for 98.7% of total peak area, with remaining impurity peaks accounting for 1.3%.
This method assumes that all impurities have similar molar absorptivity at the detection wavelength — a reasonable approximation for peptide-based impurities, less reliable for non-peptide contaminants. This is one reason why HPLC purity can slightly overstate or understate actual purity for samples with complex impurity profiles.
Reading an HPLC Chromatogram
Quick answer: Look for one dominant peak with a clean baseline return. The area percentage should match the stated purity. Secondary peaks — especially any above 1% area — warrant scrutiny and explanation.
Most chromatograms you'll encounter in peptide CoAs are relatively straightforward to interpret at the level of quality assessment, even without deep analytical chemistry training. The key is knowing what a good chromatogram looks like versus a problematic one.
What a High-Quality Chromatogram Shows
For a research-grade peptide at ≥98% purity:
- One dominant peak with clean rise and return to baseline
- Peak area percentage ≥98% (matching the reported purity)
- Any minor peaks clearly below 1% total area
- Stable baseline before and after the main peak
- Retention time within the expected range for the compound class
The retention time in minutes will vary by instrument and gradient conditions, which is why the instrument parameters matter for cross-reference. What's consistent is the relationship between peak shape, baseline, and peak area percentage.
Reading Peak Area Tables
Most CoAs accompanying chromatograms include a peak table — a tabulated list of each detected peak with its retention time, peak height, peak area (in mAU·min or arbitrary units), and area percentage. This table is where the 98.x% figure comes from. Cross-check the table against the chromatogram visually — if the numbers and the image tell different stories, the document has been modified.
Warning Signs in Chromatograms
| What You See | What It May Indicate | Severity |
|---|---|---|
| Multiple peaks of similar height | Significant impurities — not research-grade material | High |
| Sloping or drifting baseline | Column contamination or gradient miscalibration — may mask impurities | Medium |
| Peak tailing (asymmetric peak) | Column overloading or strong secondary interactions — mild purity concern | Low-Medium |
| Peak area % doesn't match stated purity | Document has been modified or numbers are from a different run | High |
| No retention time information | Incomplete data — cannot assess compound identity by retention | Medium |
| Chromatogram shows "99.99%" for every batch | Statistically improbable — suggests templated or fabricated data | High |
Purity Thresholds: The 95% and 98% Standards Explained
Quick answer: > 95% is the floor for research use; 98% is the standard for structured protocols. The difference represents a 3% impurity load that, for sensitive assays or quantitative studies, can materially affect results.
The distinction between 95% and 98% purity sounds like a minor technical quibble. In practice, it represents a meaningful difference in what impurities you're working with and how much they might matter for your specific research application.
What's in the Remaining 2% (or 5%)?
In a well-manufactured peptide, the impurities present at the 98% purity level consist primarily of:
- Deletion sequences — peptides missing one or more amino acids from the target sequence due to incomplete coupling cycles during synthesis
- Truncation products — incomplete chains resulting from premature termination of synthesis
- Deamidation products — asparagine or glutamine residues that have lost an amide group (common in Asn-containing peptides)
- Oxidation products — methionine or cysteine residues that have been oxidised (particularly relevant for storage-sensitive peptides)
- Residual TFA — trifluoroacetic acid counterions from deprotection and HPLC gradient — not detected as a peak by UV at 220nm, so technically outside the purity measurement
The biological activity of deletion sequences and truncation products varies enormously by compound. Some are essentially inert; others may have partial or aberrant activity that confounds research results. At 98%+ purity, this impurity load is low enough that most well-controlled research protocols can account for it. At 95%, the compounding effect in sensitive assays becomes significant.
When 95% Is Acceptable
For preliminary screening experiments, confirmatory assays of known effects, or research applications where the impurity profile is well-characterised, 95% purity may be analytically sufficient. The key is making an informed decision rather than defaulting to whatever specification the supplier offers. Know what you're buying and why the threshold matters for your specific protocol.
Mass Spectrometry: Identity Confirmation Beyond Purity
Quick answer: Mass spectrometry doesn't measure purity — it confirms that the compound's molecular mass matches the theoretical mass of the target peptide. HPLC and MS answer different questions, and both are necessary for a complete analytical profile.
A peptide at 99% HPLC purity is highly pure. But pure what? HPLC measures the proportion of the dominant compound without confirming that compound's identity. Mass spectrometry fills that gap by providing a molecular weight measurement that can be directly compared against the theoretical mass calculated from the peptide's amino acid sequence.
How Electrospray Ionisation MS Works
The most common mass spectrometry technique for peptides is electrospray ionisation (ESI-MS). The sample is introduced as a solution, sprayed through a charged needle that creates fine droplets, and the solvent evaporates to produce charged gas-phase ions. These ions are separated by their mass-to-charge ratio (m/z) in the mass analyser.
For peptides, ESI typically produces multiply charged ions — a 2000 Da peptide might appear as [M+2H]²⁺ at m/z 1001, or [M+3H]³⁺ at m/z 668, or several other charge states simultaneously. The actual molecular mass is calculated by deconvoluting these charge states. Modern instruments do this automatically, reporting the neutral mass (M) directly.
Reading MS Data in a CoA
A typical MS entry in a peptide CoA looks like this:
Compound: BPC-157 (Body Protection Compound-157)
Molecular Formula: C₆₂H₉₈N₁₆O₂₂
Theoretical MW: 1419.53 Da
Observed [M+H]⁺: 1420.54 Da
Δ mass: +1.01 Da (within ±2 Da tolerance) ✓
The "M+H" notation means the observed ion is the molecular mass plus one proton (1.008 Da). A tolerance of ±2 Da is standard for single-quadrupole instruments; high-resolution instruments (Orbitrap, Q-TOF) can achieve ±0.01 Da accuracy. Either is sufficient for identity confirmation; higher resolution instruments provide more definitive data.
Interpreting Mass Spectrometry Data
Quick answer: Match the observed mass against the theoretical molecular weight of your compound. A difference within ±2 Da confirms identity on most instruments. Also check for multiply charged ions — they're expected and confirm a well-ionising peptide sample.
Calculating Theoretical Peptide Mass
The theoretical molecular weight of any peptide can be calculated from its amino acid sequence. Each amino acid has a known residue mass; the total peptide mass is the sum of all residue masses plus water (18.02 Da for the terminal H and OH). Online tools like the ExPASy Peptide Mass Calculator or PeptideMass from Swiss Institute of Bioinformatics do this calculation instantly — you just enter the sequence in single-letter code.
If a CoA lists a theoretical MW that doesn't match what the calculator gives for the stated sequence, something is wrong — either the sequence is listed incorrectly, or the compound is not what the label says.
Multiply Charged Ions: What They Mean
Larger peptides (> 10 amino acids) often produce multiple charge states in ESI-MS. A CoA for a peptide like Ipamorelin (five amino acids, ~604 Da) might show a simple [M+H]⁺ ion. A CoA for CJC-1295 (~3367 Da) will typically show [M+2H]²⁺, [M+3H]³⁺, and possibly [M+4H]⁴⁺. The presence of multiply charged ions is expected for larger peptides and actually confirms good ionisation efficiency — a sign the sample preparation is appropriate.
When MS Data Raises Questions
Several MS findings warrant follow-up or caution:
- Mass shift > 2 Da — outside standard instrument tolerance, suggests wrong compound or significant modification (oxidation +16 Da, deamidation +1 Da)
- Only a single charge state for a large peptide — unusual, may indicate instrument limitations or sample complexity issues
- Multiple masses within 5 Da of each other — may indicate a mixture of closely related compounds, possibly from incomplete deprotection
- No MS data at all — only HPLC purity provided — the CoA is analytically incomplete for identity confirmation
Common Impurities in Synthetic Peptides
Quick answer: Knowing what impurities are likely in a given compound class helps you assess whether the impurity profile is consistent with expected synthesis chemistry — or whether something unexpected is present.
After reviewing 50+ PubMed studies and analytical chemistry publications on synthetic peptide quality, the impurity landscape is fairly predictable for SPPS (solid-phase peptide synthesis) compounds. Understanding what to expect makes anomalies more identifiable.
Deletion Sequences
The most common impurity class in SPPS. During synthesis, each amino acid coupling step has an efficiency slightly below 100%. Incomplete coupling leaves a growing chain that has skipped one or more amino acids. These deletion sequences are often close in mass to the target peptide (missing one residue = losing ~57-186 Da depending on the amino acid), which is why they're difficult to fully separate by HPLC. High-quality synthesis achieves coupling efficiencies above 99.9% per step, which for a 10-amino acid peptide still means a theoretical deletion rate of about 1% — consistent with 98-99% purity expectations.
Oxidation Products
Methionine residues are susceptible to oxidation, adding 16 Da (one oxygen atom) to the peptide mass. Cysteine can also oxidise, forming disulfide bonds that may alter the mass spectrometry profile. Oxidation is accelerated by improper storage (exposure to air, elevated temperature, light) and can occur after synthesis during handling. An oxidised peptide will show an additional MS peak at M+16 (or M+32 for double oxidation). Significant oxidation (> 5% by HPLC) in a new batch suggests storage or manufacturing issues.
Deamidation
Asparagine (N) and glutamine (Q) residues can deamidate under acidic conditions used in HPLC mobile phases or during storage in acidic reconstitution solvents. Deamidation converts the amide group to a carboxylate, adding +1 Da to the peptide mass. This is generally detectable by high-resolution MS and appears as a +1 Da satellite peak. At low levels (less than the 2% impurity threshold), deamidation is not analytically significant for most research applications.
Residual TFA
Trifluoroacetic acid is used extensively in SPPS deprotection and HPLC analysis. It forms ionic pairs with basic peptide residues and is often present as a counterion in lyophilised peptide preparations. TFA doesn't absorb significantly at 220nm, so it's effectively invisible to standard HPLC purity measurement. However, it can be detected by ion exchange chromatography or NMR. High TFA levels are a concern primarily for certain research applications where counterion effects matter. Premium synthesis providers routinely perform ion exchange to replace TFA with acetate — this is worth enquiring about for sensitive protocols.
Red Flags: When a CoA Isn't What It Claims to Be
Quick answer: Fabricated or misleading CoAs exist in this market. The red flags below are based on documented patterns — not hypothetical scenarios.
The emergence of opportunistic suppliers following the Peptide Sciences closure has made CoA fraud more prevalent. The following red flags have been documented across forum reports, analytical verification exercises, and direct supplier assessments.
Suspiciously Round Purity Figures
Real HPLC purity measurements don't reliably produce round numbers. Real-world results look like 98.3%, 97.8%, 99.1% — not 99.00%, 98.00%, or exactly 99.5% on every single batch. If every CoA from a supplier shows purity at exactly one or two decimal places that happen to be identical across multiple batches, the data has almost certainly been templated rather than measured.
No Lot Number or Analysis Date
The most reliable indicator of a generic versus batch-specific CoA is the absence of a lot number. Without a lot number, there's no way to connect the CoA to the physical vial you received. Without an analysis date, the measurement could be years old and the current batch may have degraded significantly. Both elements are mandatory in any analytically meaningful CoA.
Unlicensed Laboratory Names
Search the testing laboratory named on any CoA. Does it have a web presence? Are there other supplier CoAs that list the same lab? Can you find the lab's own website with contact information and service descriptions? Several fictitious laboratory names have circulated in the research compound market — names that look credible but have no independent web presence and cannot be verified.
Chromatograms That Don't Match the Numbers
If a CoA shows a chromatogram image with a visually obvious secondary peak at 5-10% area, but the peak area table reports 99% purity, the document has been modified. The chromatogram image and the peak area table must be internally consistent. This kind of modification is more common than it should be.
Mass Matching a Different Compound
A 2024 analysis published in research forums documented cases where supplier CoAs showed MS data that matched a compound other than the one stated on the label — specifically cases where a supplier had substituted a structurally similar but different peptide. This requires calculating the theoretical mass yourself and comparing it to the observed mass on the CoA. If they match each other but not the stated compound, something is very wrong.
Verifying Janoshik CoAs: The Step-by-Step Process
Quick answer: Verification takes approximately 90 seconds and is the single most effective fraud-detection step available to researchers without in-house analytical capability.
Janoshik's verification system is the closest thing the research peptide market has to a trusted independent authentication service. Here's the exact process:
- Locate the submission or sample reference number on the CoA document — typically in the header or footer, formatted as a numeric string or alphanumeric code
- Navigate to janoshik.com and find the results search function (typically under "Results" or "Database")
- Enter the submission reference number in the search field
- Compare the returned result to the CoA document: compound name, purity percentage, analysis date, and molecular weight should all match exactly
- If the search returns no result, the submission number is invalid — the document is not a genuine Janoshik CoA
- If the results don't match the document (different purity figure, different compound name, different date), the document has been modified
Note that some Janoshik clients submit samples as private, meaning the results aren't publicly searchable. A supplier can legitimately have Janoshik CoAs that aren't verifiable via the public database. In this case, request a publicly submitted sample for at least one batch — a supplier genuinely committed to transparency should be willing to accommodate this.
UNIK LAB’s Janoshik CoAs are batch-specific and fully traceable. For a full explanation of testing standards, see the reference standard definition in our research glossary. View our Certificate of Analysis documentation standards — we walk through exactly what each element means and how to verify it independently.
The Complete CoA Evaluation Checklist
Quick answer: Apply this checklist to every CoA from every supplier — including established ones. Quality can change with batch, personnel changes, or supply chain shifts. Consistent verification is the only reliable approach.
Peptide CoA Evaluation Checklist
Peptide Analysis: Quick Reference for Common Compounds
The table below provides theoretical molecular weights for commonly researched peptides. Cross-check these values against MS data in any CoA you receive.
| COMPOUND | SEQUENCE LENGTH | THEORETICAL MW (Da) | EXPECTED [M+H]⁺ |
|---|---|---|---|
| BPC-157 | 15 aa | 1419.53 | 1420.54 |
| Ipamorelin | 5 aa | 711.85 | 712.86 |
| CJC-1295 (no DAC) | 29 aa | 3367.97 | 1684.99 [M+2H]²⁺ |
| Sermorelin | 29 aa | 3357.93 | 1680.47 [M+2H]²⁺ |
| TB-500 (Thymosin β4 fragment) | 17 aa | 2111.30 | 1056.16 [M+2H]²⁺ |
| Epithalon (Epitalon) | 4 aa | 390.35 | 391.36 |
| GHRP-6 | 6 aa | 873.02 | 874.03 |
| Follistatin 344 | 344 aa | ~37,000 | Multiple charge states |
Molecular weights are theoretical values calculated from amino acid residue masses. Actual observed MS values may differ by ±2 Da on standard instruments, ±0.05 Da on high-resolution instruments. All values for the free acid form of the unmodified peptide unless otherwise noted.
Frequently Asked Questions
What is HPLC purity and why does it matter for research peptides?
HPLC purity measures the proportion of your target compound relative to all detectable substances in the sample, expressed as a percentage of total chromatographic peak area. For research peptides, ≥98% is the standard minimum — at this level, impurities are below the threshold that would significantly affect most structured research protocols. Anything below 95% introduces an impurity load that can confound quantitative assays.
What is the difference between HPLC and mass spectrometry in a peptide CoA?
They answer different questions. HPLC tells you how pure the sample is — what percentage of it is your target compound. Mass spectrometry tells you what the compound is — confirming its molecular mass matches the theoretical value for the stated peptide. A sample can be very pure HPLC-wise but be the wrong compound. Both analyses together provide complete analytical confidence in purity and identity.
How do I read an HPLC chromatogram?
Look for one dominant peak with a clean baseline. The area percentage of that peak (shown in the accompanying peak table) should match the stated purity — if the CoA says 98.4%, the main peak should show 98.4% area. Any secondary peaks above 1% area warrant explanation. A drifting baseline, multiple peaks of similar height, or peak area numbers that don't match the visual chromatogram are all red flags.
What does "M+H" mean in a peptide mass spectrometry report?
M+H (more precisely [M+H]⁺) is the protonated molecular ion — the compound's molecular mass (M) plus one proton (H, 1.008 Da). In electrospray ionisation mass spectrometry, compounds are detected as charged ions; adding a proton creates the +1 charge needed for detection. If the CoA shows Observed [M+H]⁺ = 1420.5 and Expected = 1420.5, this confirms the compound's molecular identity.
What are red flags in a peptide Certificate of Analysis?
Missing lot number or analysis date (generic, not batch-specific). Purity figures that are suspiciously round and identical across batches. Testing laboratory with no independent web presence. Chromatogram images that don't match peak area table numbers. No mass spectrometry data. Theoretical MW that doesn't match the stated compound's calculated mass. These patterns are consistent with fabricated or templated documents rather than genuine analytical results.
How can I verify a Certificate of Analysis from Janoshik?
Find the submission reference number on the CoA (typically in the header or footer). Go to janoshik.com and use their results search function. Enter the submission number. Compare the returned result — compound name, purity, date, and molecular weight — to the CoA document. If the submission number returns no results or mismatched data, the document is not a genuine Janoshik CoA.
Analytical Standards
UNIK LAB Certificate of Analysis
Every UNIK LAB batch ships with a Janoshik third-party CoA — batch-specific, HPLC + MS, publicly verifiable.